Starting in 2022, we are offering lactate profiling at all Alpine Cols coaching camps. The benefit is to determine your training zones accurately, and especially to identify your base training aerobic threshold.
Why does this matter?
The simplest reply to this question is that if we train at the “wrong” intensity, we won’t get the adaptations we are training for. In other words, our training will be at best sub-optimum and at worst either a partial or a complete waste of time!
If I take my own personal case, I discovered through lactate profiling that I have been doing my low-intensity endurance rides too hard for years, thus creating a lot of extra fatigue for no benefit and preventing me from becoming as strong as I could have been.
Workout intensity
How do we know how hard the workout should be, and then how do we know how hard it is in practice? These questions are a lot more complex than they might appear, but I’m going to keep things as simple as possible.
“How hard” is a function of both time and intensity. Our concern here is with the intensity, and how to prescribe the right level in terms that we can reliably carry out on the bike. This is usually done by reference to training “zones”, which begs the question: how are these zones determined?
Many amateur riders and their coaches determine their zones using one of the auto-calculation methods such as those in Training Peaks, e.g. Dr Andrew Coggan’s 6-Zone model (originally published in Training and Racing with a Power Meter). Plenty of other models exist. Some may use 5 zones, others 7 (or more) but in most cases the zones are based on percentages of a single reference value such as Functional Threshold Power, Maximum Aerobic Power, Functional Threshold Heart Rate or Maximum Heart Rate.
There are three problems with all of these auto-calculations.
The first is the accuracy of the reference value, (e.g. FTP) all of which are subject to significant estimation and measurement errors. The second problem is that the percentages used to calculate the zone boundaries (e.g. Coggan defines the top of Zone 2 as 74% of FTP) are based on population averages and take no account of individual differences. There are in fact wide variations between people, with the result that the zone boundaries can be out by as much as 30-40W and 15-20bpm. I’ll come to the third problem below.
So if we can’t rely on individual FTP or heart rate measurements to determine our zones, what can we do?
Our Zones should be determined by measuring our own specific physiological markers.
There are two key physiological markers that are widely used in endurance sport: blood lactate and the gas exchange ratio. If you do a lab test both will be measured. They provide different and complementary ways to identify the same physiological threshold, which together with Critical Power can then be used to set our own individualised Zone models. This is the way training zones are set for professional athletes, and now the wide availability of portable lactate test units has made the method available to the amateur peloton too.
This brings us to our third problem with the common training zone models: there is no scientific validity for anything more than 3 zones, because there are only two physiological markers. The changes that take place below LT1, between LT1 and LT2 and above LT2 are continuous and the decision to split any of these 3 zones into two or more is arbitrary and purely for convenience.
To put it another way, cross either LT1 or LT2 and our bodies start to respond differently (see below for more). Cross any of the intermediate zone boundaries in a 5, 6 or 7 zone model and nothing of note changes, it’s just slightly more of the same. There is a specific sprint zone at the very top end but this is of little or no relevance to Granfondo riders.
Lactate profiling: what is it?
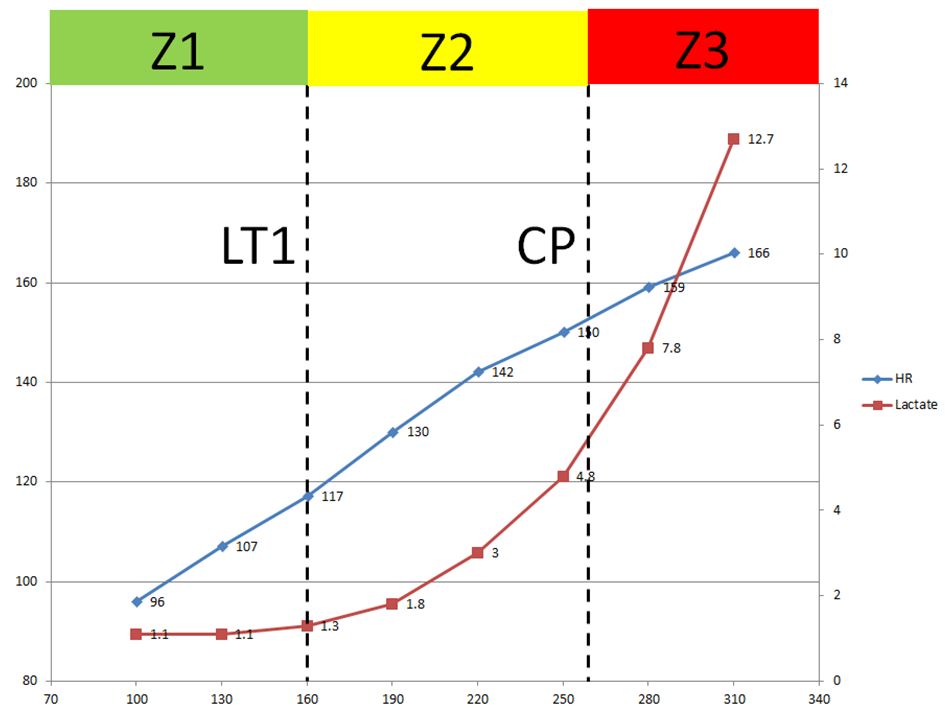
The chart shows a typical lactate profile for an amateur cyclist. The profile was obtained via a step test in which the cyclist pedalled at a series of pre-determined power levels, staying at each level for 3 minutes (long enough for heart rate and blood lactate to stabilise). The lactate was measured in the final minute of each step, via a drop of blood extracted from a pricked finger.
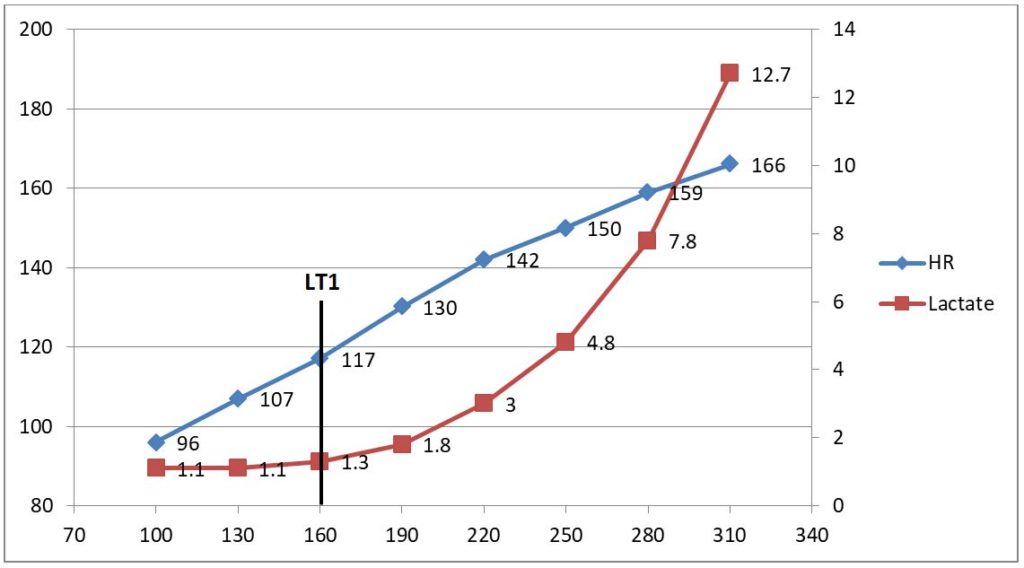
Both heart rate and lactate are plotted against power, and the lactate threshold (LT1, the point at which lactate begins to increase from base levels) can then be read from the lactate curve. This particular test was carried out with 30W steps every 3 minutes, leading to some uncertainty as to where to estimate LT1: it could be anywhere between 150W and 170W. To increase the accuracy the steps could be reduced to 15 or 20W.
It is theoretically possible to read LT2 (the point at which lactate production exceeds its rate of clearance) from the same curve but this is subject to interpretation error as there’s no obvious breakpoint. For some people, this is roughly the same level as FTP. Many scientists and coaches agree that Critical Power is a better way to measure it.
To determine Critical Power we need to do at least two and ideally three max efforts with durations between 2 and 20 minutes. The relationship between power and duration in this timeframe follows a simple mathematical formula so it is easy either to calculate Critical Power yourself or use an online calculator. In my case, I use Golden Cheetah to do it automatically.
Now we have our two physiological markers, we have our three zones.
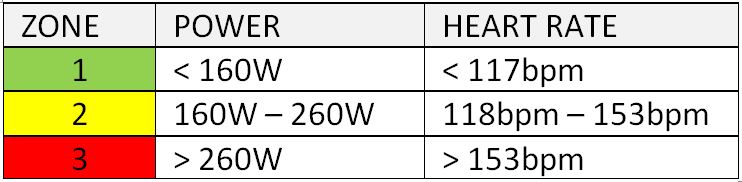

If you want to use five zones you can split Zones 1 and 2 into two zones each, making LT1 the upper bound to Zone 2 and LT2 the upper bound to Zone 4. You can then further split the high intensity Zone 3 (from the three zone model) into three more zones, 5, 6 and 7. Whether there’s any point in doing this will depend on the event you are training for and on your (or your coach’s) preferences.
Further reading
Endurance Physiology 101: the basics (Alan Couzens)
Interpreting Lactate Curves for Ironman Athletes (Alan Couzens)
Blood Lactate Testing Protocols for Cyclists (HighNorth)
Videos & Podcasts
Deep dive back into Zone 2 Training (Iñigo San-Millán, Ph.D. & Peter Attia, M.D.)
Mitochondria, Lactate as a Fuel & Zone 2 Training (Upside Strength: Iñigo San-Millán)
Lactate Threshold (That Triathlon Show: Mark Burnley, PhD)
I do agree with all the ideas you have introduced on your post. They are very convincing and will definitely work. Still, the posts are very short for newbies. May just you please prolong them a little from subsequent time? Thank you for the post.